Flood Risk Mapping
This document examines a few datasets for flood risk mapping from the UK Environment Agency (EA), the UK Dept. for Environment and Rural Affairs (DEFRA) and Ordinance Survey. These datasets include digital
elevation models (DEM) - both Digital Terrain models (DTMs) and Digital Surface Models (DSMs) along with specific flood risk spatial products.
DEFRA has a nice open web portal available here. This is a nice portal where entire datasets can be downloaded or a polygon can be used to
make a selection via an interactive map.
In this document, I first have a play with the DSM and DTM to create a very crude model of a river bursting it's banks by 3m. I then go on to explore the vector risk maps provided to DEFRA to see how they
compare.
Manual Play with DEMs
A hydrologist should be contracted for modelling flood risk. I'm certainly not a hydrologist so make no attempt here to provide a detailed model. Here, I simply prepare a very crude and basic model to
familarize myself with the lidar data and explore some functionality of QGIS in terms of presentation. The area understudy is my home village of Eckington in sunny South Yorkshire. I have some knowledge
of previous flooding events and their geospatial extent. I was therefore able to massage the figures (selecting 3m above the riverbank) to obtain an area of flooding that is realistic.
An outline of the steps taken were as follows:
- I downloaded lidar DSM and DTM 1m data from DEFRA using their great online interactive map. The DSM is the surface of the earth scanned including trees, building etc. whereas the DTM has these latter items removed and presents the minimum surface encoutnered (i.e. the earth's surface).
- Building footprints were brought in from Open Street Map using the OSM plugin in QGIS to extract these.
- A rivers dataset is available from DEFRA. A boundary for the area was the post code polygon for "S21" from Ordinance Survey.
- The buildings were transformed to the the same spatial reference as the other datasets (OSGB).
- I wanted to get the height of the buildings (really just to play - having seen this done in a youtube video) therefore I used a raster calculaltion to subtract the DTM from the DSM. Where there were
buildings or other features, the output from this calculation would give me their height above the DTM.
I was then able to run the "Zonal Statistics" tool to get the mean height from this new raster over the area of the building footprints. This worked well. I was then able to view the data using a QGIS 3D Map (as per the banner on this page). While a very nice visualisation, this started to melt my old laptop so was ultimately discarded (mental note - buy a proper computer with a graphics card!). - To develop a flood risk area, I first identifid the height of the river and the river bank by manually inspecting the DTM.
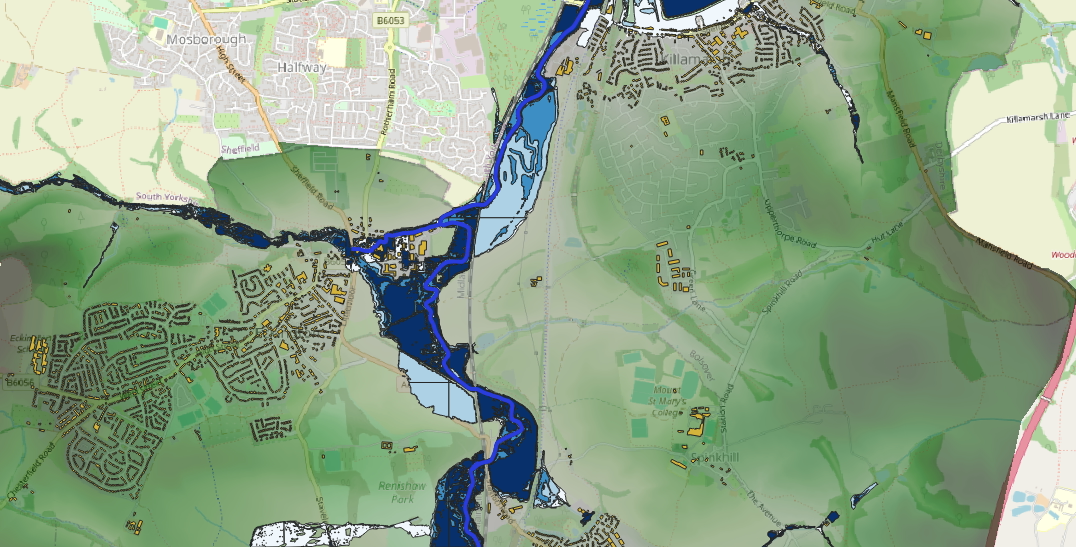
- The raster calculator was used to create a binary raster showing all areas where the height was less than 48m (3m above the average river bank height). This raster was then converted to a vector layer.
- The output is provided below. The DTM is presented, as hillshade and coloured and transparent showing elevation. These are overlaid with the building footprints, river and the flood risk area.
- Althought this is quite a crude method it gives a rough approximation of the area that could be affected by flooding. My knowledge of the area under study helped determine the area, and as we see below, it is not a million miles away from the DEFRA modelled data.
DEFRA Datasets
The UK has experienced significant flooding in recent years and this, combined with concerns regarding global warming, has prompted the government to dedicate resources to enhanced flood risk mapping. Therefore
DEFRA and EA have a number of datasets available to aid with mapping risk.
Risk of events would typically be provided as a "return period" and a magnitude to express the risk in terms of likelhood/probability per X years. e.g. flood levels might reach X metres once in 30 years. Under this approach
an event is classified as per the return period and we hear things like "a once in a lifetime event" or an event that would occur "only once in a hundred years".
Howwver, the approach taken in the DEFRA datasets is instead to express the risk as a probability of an event per year. e.g there is a 0.5% chance of X happening per year. I assume this format
is considered more easily digestible by the general public.
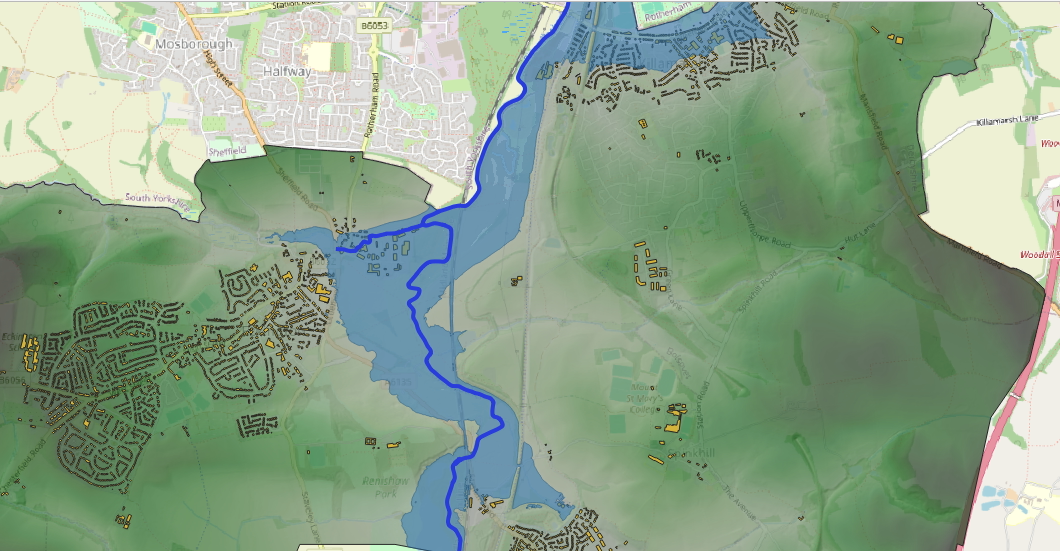
I present a map below containing the DTM, building footprints and a DEFRA layer that shows the categorized risk (very low, low, medium, high) of a 2m deep flood occuring in any given year. My rough and ready map above is pretty good!
I must have been a hydrologist in a former life!
The DEFRA datasets are great. Some of those available include:
- Statutory main rivers (here)
- Risk of flooding from surface water (runoff) (here)
- Historic floods maps (all floods or with features for specific events) (here)
- Flood maps for planning (Zone 2/3 - these are risk levels). (here)
- Flood defences (here)